
Access tools via the menu bar at the top of the page.
- Toggle Legend: (
) Allow the user to control the display or hiding of the legend.
- Basemap Gallery: (
) Select from five different map canvas images for base map.
- Road View: (
) Allows you to view a road images from three different positions. Mile Post (MP) matrix providing road position details, Along with car symbol
displaying location on the map.
- Query Tool: (
) Allows the user to create on a given dataset.
- Measurement Tools: (
) Plot coordinates and make measurements on the map.
- Print: (
) Allows the user to print the map with displayed markings and layers that are on the map.
- Draw Tool: (
) Allows the user to markup or draw on the map.
- Reports: (
) Drop down menu that contains a list of standard reports.
- RIP Cycle: (
- Info: (
- Search: Text box to perform search of primary key indexes, Parks, Routes, Bridge Structure Number, Guard / Retaining Wall Barrier ID, Crash Incident Number.
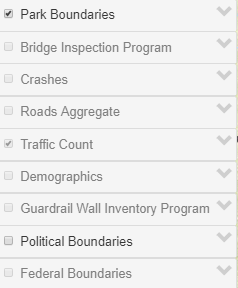
By default, the Legend Panel ( ) appears in upper right corner of the map area. By clicking on the
( ) icon in the menu bar will allow hiding or displaying the legend panel.
Hiding the panel will allow more visible real estate for viewing of the map and other features.
By selecting the "Basemap Gallery" icon ( )
from the menu bar a list of 5 map choices will appear under the menu.
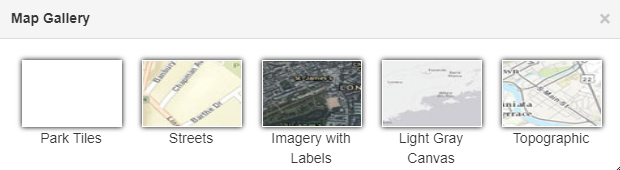
Navigator provides five (5) different selections to pick from for defining your base map layer. The default selection is "Streets" map.
Once you have selected your base map you can click on the "x" in the local window menu or click on the icon ( )
again to close the gallery map menu.
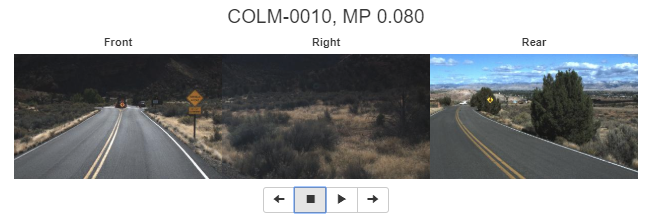
Navigator Road View tool ( ) provides three components, 1) the road viewer, 2) road data set matrix, and 3) the car
symbol to indicate where the location is along the road segment. As you progress through the park the pictures change, the highlight line in the road matrix changes
indicating where you are at along that road segment and the car symbol will move along the road map to indicate your map location.
The Road Viewer tool provides three different views from a single position as you travel through a park. The Front view, is as if your were driving the vehicle down the road. The right side will display any road side features or sign-age on the right. The rear view position will display the other directions road side features or sign-age. The header block will display "Route Identifier" (park code and route number), mile post (MP) number (two-tenth of a mile segments).
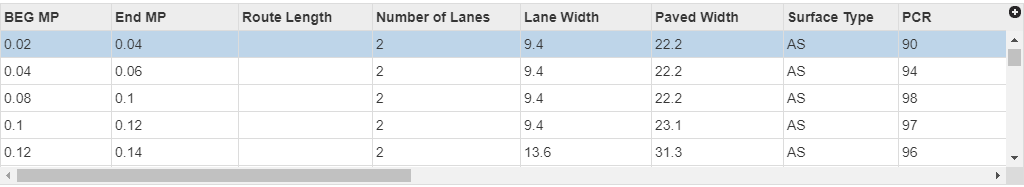
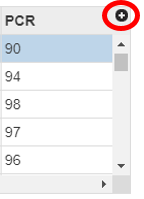
The Road data set matrix tool provides the user with a mile post road position details. The mile post (MP) increment is set at two-tenth of a mile.
By default, the full list of road elements are displayed. The user has the ability to turn off any data elements that are not needed.
Note: User can click on any of the header labels to activate an ascending or descending sort list.
As the user progress through the viewer the list of elements will be updated and the highlighted line will indicate where the user is at along the mileposts markers.
|
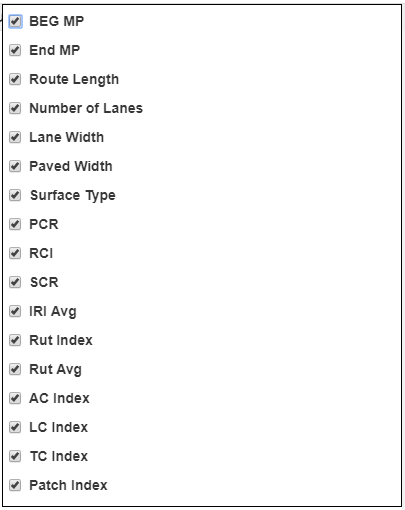
In the right corner of the matrix may show a "+" sign by clicking on it will create a window that shows all available data elements for road details. |
|
|
The user may check or un-check any of the boxes to add or remove/hide unwanted data elements to be displayed in the matrix. |
|
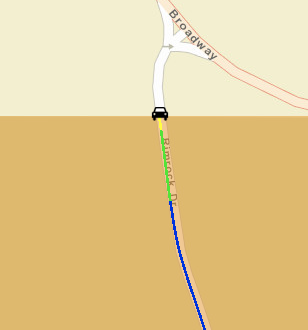
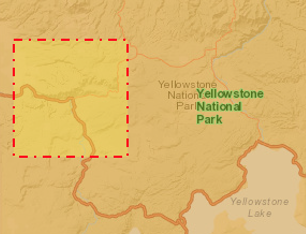
A car symbol will display on the base map indicating where the user is located along the road segment.
The car symbol will move along the road as video (pictures) progress along the road.
The Query tool ( ) provides options for selecting data by adding conditions to layers of interest.
The following are steps to create a simple query.
|
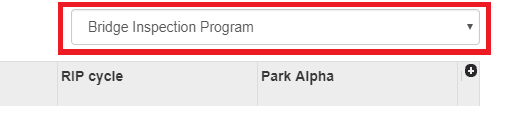
The user selects a dataset layer from a drop down list located on the right side of the query window. By clicking on the
drop down arrow a list of available dataset will be displayed. |
|
|
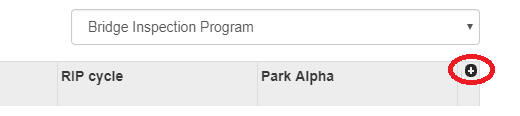
Once the dataset is selected the user can than pick and choose what data fields from that dataset to be display. In the right corner of the query window their may
show a "+" sign by clicking on it will create a window that shows all available dataset query fields. |
|
|
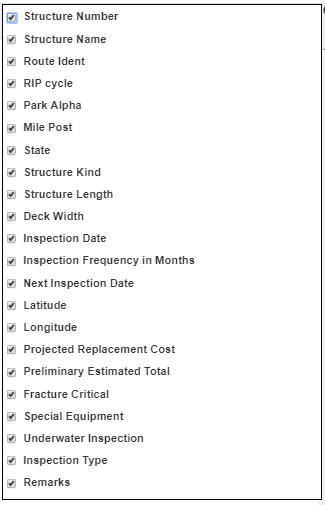
The user may check or un-check any of the check boxes to add or remove/hide unwanted data elements to be displayed in the query results. |
|
|
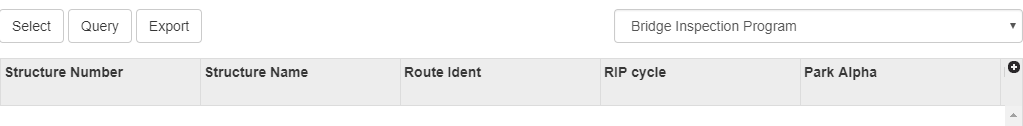
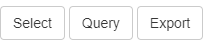
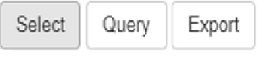
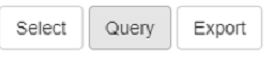
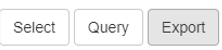
The user can than choose either "Select" or "Query" to start the query process. The third button "Export" is used once the user has completed
their query and the results are shown in the output matrix. |
|
|
|
|
|
|
 |
|
|
|
|
A window will appear to assist in creating the query. Use the drop downs to define your search conditions. |
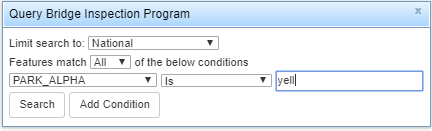 |
|
|
 |
|
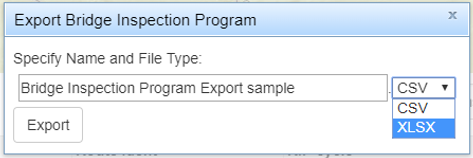
Once the user has the desired query results. A window will appear to assist in exporting
the data to the local machine. The user can use the default file name or define their own file name.
The user has two output formats choices to pick from. The user can export the results as a table in ‘csv’ or ‘xsls’. |
|
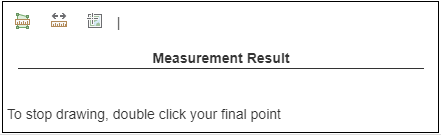
The Measurement tool ( ) contains tools that allow you to find plot coordinates, measure an area or distance.
|
The "location" coordinates tool |
|
|
The "distance" tool |
|
|
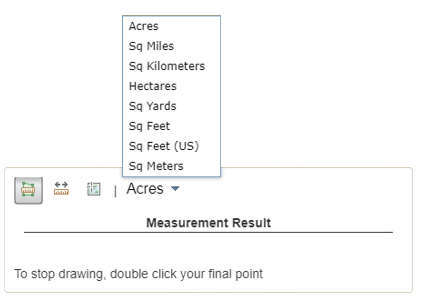
The "area" tool |
|
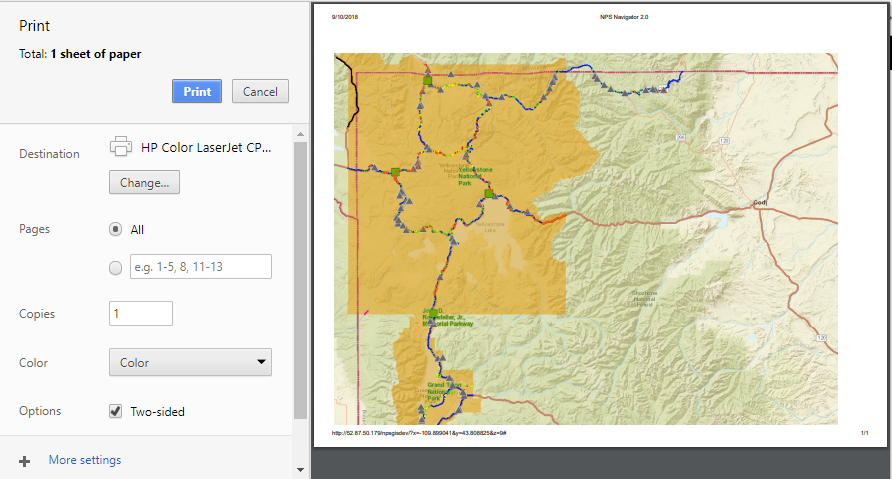
The Print ( ) icon allows you to print the map with selected layer features and/or items placed on the map, less the legend.
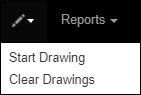
The Draw tool ( ) contains actions like starts,stop and clearing the screen of any drawing content.
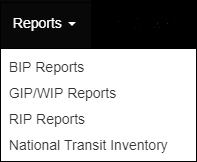
The Reports list ( ) provides a list from a drop down of standard reports.
|
The "BIP Report" create a new window or tab to provide a list of available Bridge Inspection Program (BIP) reports. The bridge reports are sorted by park alpha code in descending order.
The page displays basic details like bridge name and structure number. The user can then click on the structure number link or the BIP Report PDF icon to open the report. |
|
The "GIP/WIP Report" create a new window or tab to provide a list of available Wall Inventory Program (WIP) or Guardwall/Rail Inventory Program (GIP) reports.
The reports are sorted by park alpha code in descending order.
The page displays basic details like park name and structure number. The user can then click on the PDF icon to open the report. |
|
The "RIP Report" create a new window or tab to provide a list of available Roadway Inventory Programs (RIP) reports. The report are sorted by park alpha code in descending order.
The page displays a grid like structure sorted by park order. The grid provides basic details by cycle. The user can then click on the PDF icon to open the report. |
|
The "National Transit Inventory" drop down menu item creates a new window or tab to a link to U.S. Department of Transportation Volpe Center website. |
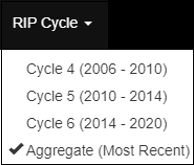
The RIP Cycle list ( ) allows the user to select which cycle data to display on the base map.
The selected RIP cycle will also be displayed in the legend provided it is actively displayed.
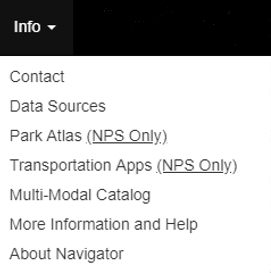
The Info list ( ) provides a list of helpful pop-up windows, links or reference subjects.
The Search text box allows the user to perform search of primary key indexes like Park names, Park Alpha code, Routes, Bridge Structure Number, Guard / Retaining Wall Barrier ID, Crash Incident Number.

 allows you to find the Latitude and Longitude
of a specific location. The Location tool opens a sub-menu to select what feature unit type you want to display results in.
allows you to find the Latitude and Longitude
of a specific location. The Location tool opens a sub-menu to select what feature unit type you want to display results in. 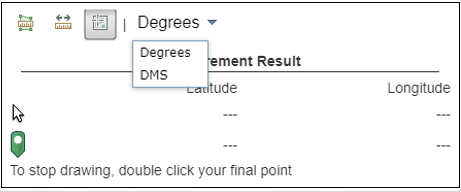
 allows you to draw and display on the map the total running distance between two or more points.
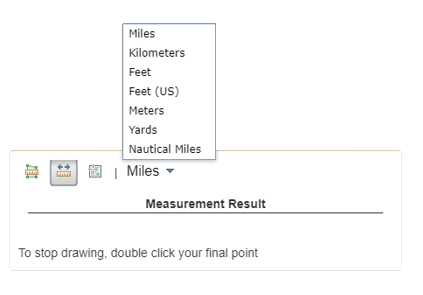
The distance tool opens a sub-menu to to allow you to select what feature unit type you want measure in and display your results in. You locate your starting point (single click) and continue
to do single clicks to step along your path. To stop drawing, double click your final point. The results are in your measurement results window.
allows you to draw and display on the map the total running distance between two or more points.
The distance tool opens a sub-menu to to allow you to select what feature unit type you want measure in and display your results in. You locate your starting point (single click) and continue
to do single clicks to step along your path. To stop drawing, double click your final point. The results are in your measurement results window.  allows you to draw and display on the map the total running area between three or more points.
The area tool opens a sub-menu to select what feature unit type you want to measure in and display your results in. You locate your starting point (single click) and continue
to do single clicks to step along your area path. To stop drawing, double click your final point. The results are in your measurement results window.
allows you to draw and display on the map the total running area between three or more points.
The area tool opens a sub-menu to select what feature unit type you want to measure in and display your results in. You locate your starting point (single click) and continue
to do single clicks to step along your area path. To stop drawing, double click your final point. The results are in your measurement results window.